What got me into this blog topic was a recent posting by Real Engineering on Nebula looking at how video streaming services work. In the posting, the presenter gave some arm-wavy stats on the relative breakdown of their costs.
Oh, by the way: Rebecca Drew is AWESOME (she told me if I said that, she’d forward my blog on to her mates 🙂 )
Arm-wavy Statistics
Cost of Capital: capital is “cheap” and substitutable
The presenter mentioned there was a typical misconception that storage space and bandwidth are the expensive aspects of a web-streaming service. While initially true, technology and global developments make this is no longer the case.
Nebula subscriber base has grown incredibly quickly, and has more than doubled over the last year. As of September 2023, it had about 300,000 active users viewing content. It’s entire viewing catalogue was around 30 terabytes. However, it spent less than $USD 20,000 per month on bandwidth, and paid less than $200 per month to store it within Amazon’s Web Service’s S3 and Backblaze B2 cloud storage systems. Nebula’s storage costs alone are less than Real Engineering’s monthly Adobe software licensing fees.
… And did I mention Nebula doesn’t own the capital cost of the servers?!?
Cost of Labour: labour is “expensive” and irreplaceable
The presenter outlined by far Nebula’s biggest hard cost was associated with hiring talented engineers to create and support the entire IT system: its labour costs.
A successful streaming service providing a quality service has a lot of moving IT people parts. Both Front-end and Back-end developers were needed to create the API interfaces to the storage systems and databases, and connect those to the user front-end interfaces and mobile apps. They needed Software Testers and Engineering DevOps technical support people to make sure all the systems were error free and hung together.
They needed countless product designers and user app designers to bring the viewing experience to the variety of devices that global users wanted to watch Nebula upon. There are different kinds of user apps: web apps, mobile apps, desktop apps and TV apps, almost always each required the application to be written into completely separate programming languages, like Swift for iOS, Kotlin for Android, JavaScript or TypeScript for smart TVs, and incredibly niech languages like Brightscript for Roku. Each language was needed to address specific differences related to each technology-specific delivery channel.
In addition to IT development labour, corporate labour was needed to engage with external device manufactures and deploy the systems out to the different devices. Each device usually required the device-specific app to be distributed through the operating system’s proprietary “app store”. Negotiating each device created compliance costs. For example, Nebula was told by LG TVs that their service contravened LGBT policies for 34 countries, which required them to remove whatever LGBT content was within their catalogue from approximately 34 countries.
Some countries “are allowed” to view it, others were not…
Labour Returns to Production from IT
Now, as you all know, all economics is very interesting.
But I put it to you, dear reader, that production economics are the most interesting aspects of economics.
The concept of the production function describes how inputs to production (capital / labour) combine together to make output. And within the production function for different industries, labour and capital have different degrees of substitutability: how “easy” it is to replace capital inputs with labour, and vice versa. And, dear reader, technological change can be expressed through the production function which, over time, effects the substitutability of capital for labour. For example, AI (capital) now threatens to make whole swathes of labour unemployed (which may or may not be exaggerated). But fundamentally, technology is the source of economic growth. About 3 weeks ago, an Economic Giant in the economic growth theoretical field sadly died 🙁
The substitutability of the inputs into the production process determine the Economic Returns to Production: how much of the value added of an industry “return” to the owners of capital and the owners of “labour”. If this all sounds very Marxian its because it is: Marx drew his thinking from David Ricardo: one of the biggest economic thinkers ever.
Given the anecdotal evidence from Real Engineering that ICT capital is substitutable, but ICT labour isn’t, then you would expect that IT-dominant industries would use competition and substitutability to drive down their capital costs, but get bent over a barrel and pay through the nose for their scarce skilled labour: the returns to labour would be higher than the returns to capital.
A True Story for New Zealand?
While New Zealand isn’t like the United States of America where Nebula is based, I live in New Zealand and am currently contracted to a bank doing an IT role, so I was interested in seeing if this story holds up for New Zealand IT industry.
And just as a counterpoint, I also wanted to check how the returns to labour from ICT-dominant industries compared between New Zealand and Australia. New Zealand publishes a more granular industry breakdown than Australia (yay!), and I had to do some aggregation to make a valid comparison between the two countries (boo!)
Here’s my source data: Returns to Labour – NZ Aust Comparison
Pick an Industry
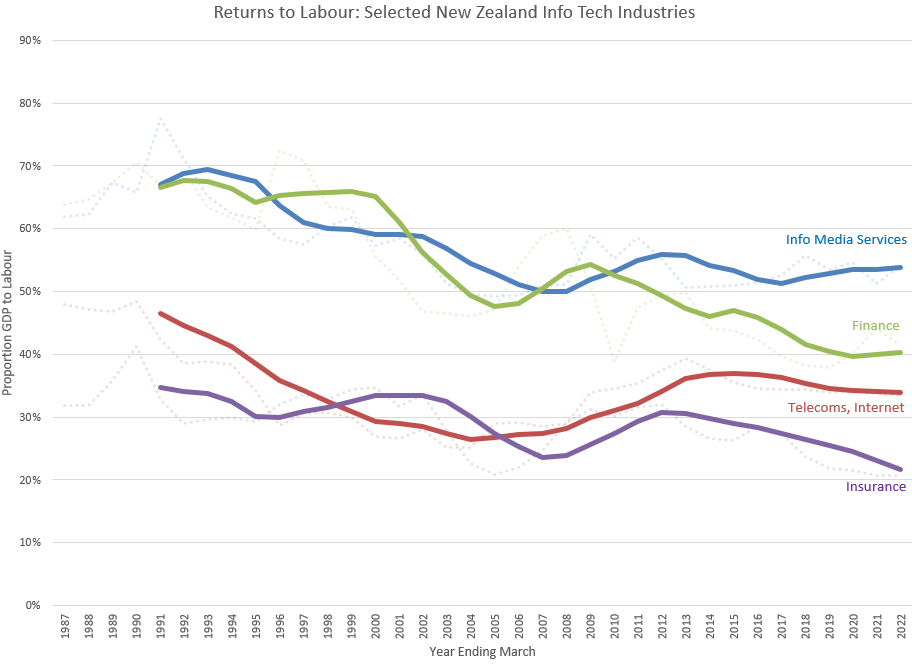
While Information and Communication Technology (ICT) is in all industries, in some industries it dominates more than others. Prime candidates are JJ11 – Information Media Services, which includes broadcasting and internet publishing (aka: web-streaming industries), and JJ12 – Telecommunications, Internet and Library Services.

Working in a bank, other ICT-heavy industries potentially include the finance and superannuation industries, although they’re capital assets (ie. money) are extensive and probably dominate the “returns” from production. I didn’t really want to include the superannuation industry, but I had to to enable a valid trans-Tasman comparison of the finance industry (poos… 🙁 )
Still. Lets have a looksie at the results…
Information Media Services: A Labour Intensive Industry
Confirming Real Engineering’s story, New Zealand’s Information Media Services Industry (JJ11) is indeed a labour-intensive industry where over half of the returns to production accrue to labour, compared to capital.
Hollowed out Banks?
Interestingly, New Zealand’s finance industry used to be a labour intensive industry. In the late 1980’s and early 1990’s, over 60% of the value added generated by banks accrued to their workforce. However, since approximately 2003, the entire industry has shifted to become a capital intensive industry, where the majority of the value added now returns to the owners of capital.
About the same time as New Zealand’s finance sector was sold to the Australians… A shift from a labour intensive to a capital intensive industry is consistent with the “hollowing out” of the banking sector, where key New Zealand banking functions are replaced with personnel within Australia’s workforce:
The Reserve Bank’s growing focus on local incorporation and outsourcing reflected the obvious dominance of the Australian-owned banks within the New Zealand banking system and an associated ‘hollowing out’ of functions (the shift of key tasks to Australia).
New Zealand Reserve Bank,Bulletin Vol. 79, No. 14 August 2016, https://www.treasury.govt.nz/sites/default/files/2018-06/rbnz-3924759.pdf page 14
Telecommunications: A Shift from Landline to Mobile Technology
Telecommunications is a interesting industry: while its not labour intensive, it has become more labour intensive over time, reflecting the potential effects of both a shift away from land-based technologies to mobile technologies, and the entrance of mobile telecommunication providers like 2 Degrees. The land-based telecommunication infrastructure is a regulated industry, with its fibre infrastructure opened to competition, and new mobile technologies providing substitutable services. Its entirely likely the lift in returns to labour reflects the growth of a ICT-centric telecommunications workforce within the industry
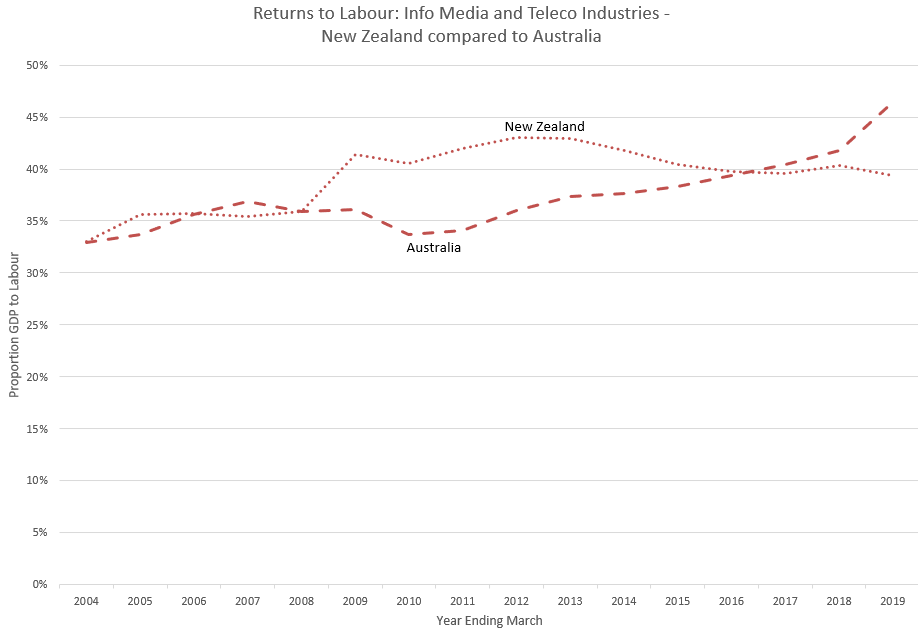
Trans-Tasman Comparisons
Unlike New Zealand, the Australian Bureau of Statistics publishes their GDP(I) statistics at an aggregated industry level preventing the types of sub-industry analysis that is possible from Statistics New Zealand data (well.. using publicly available data).
None of their available statistics suggest their aggregated ICT and Finance/Insurance industries are labour-intensive, although the aggregation of the Information Media Services with the Telecommunications Services industries might by obscuring true differences within each:
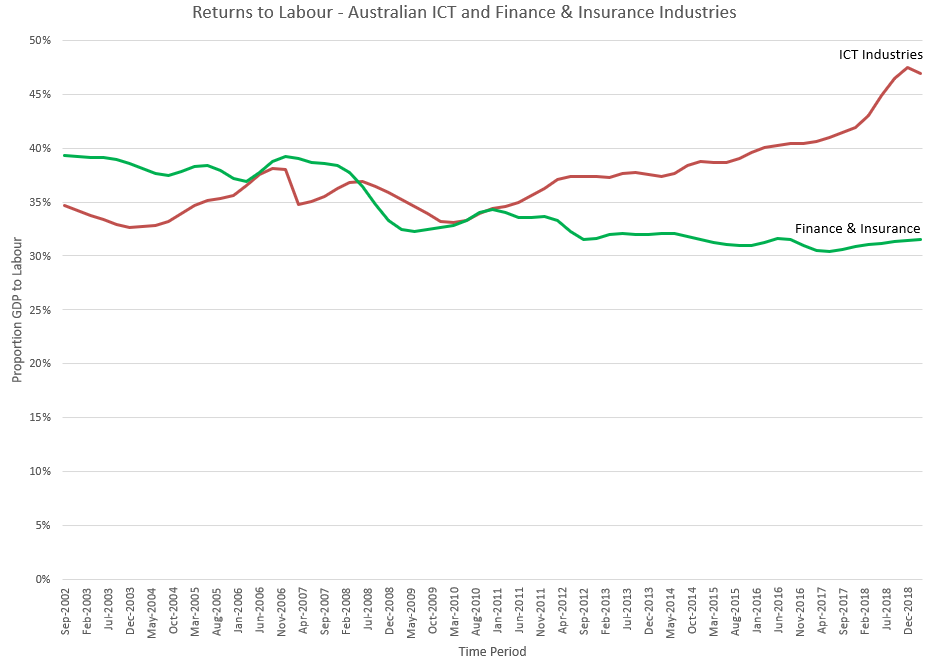
Over time, their aggregated ICT industry is close to becoming labour intensive, which might reflect either a change in the proportion each smaller industry contributes to the aggregate measure, as well as the same change occurring within the Australian telecommunication industry as it becomes more ICT-intensive.
There’s a little bit of “who knows?” going on because of the aggregation of the finer detail metrics (again… poos.)
Finance Industry Comparison: An Aggregated Data Mess?
Finally, a comparison of the aggregated Finance and Insurance industries shows no sign of any shift towards ICT-driven increased labour intensity. Both countries aggregated finance and insurance industries are highly-capital intensive.
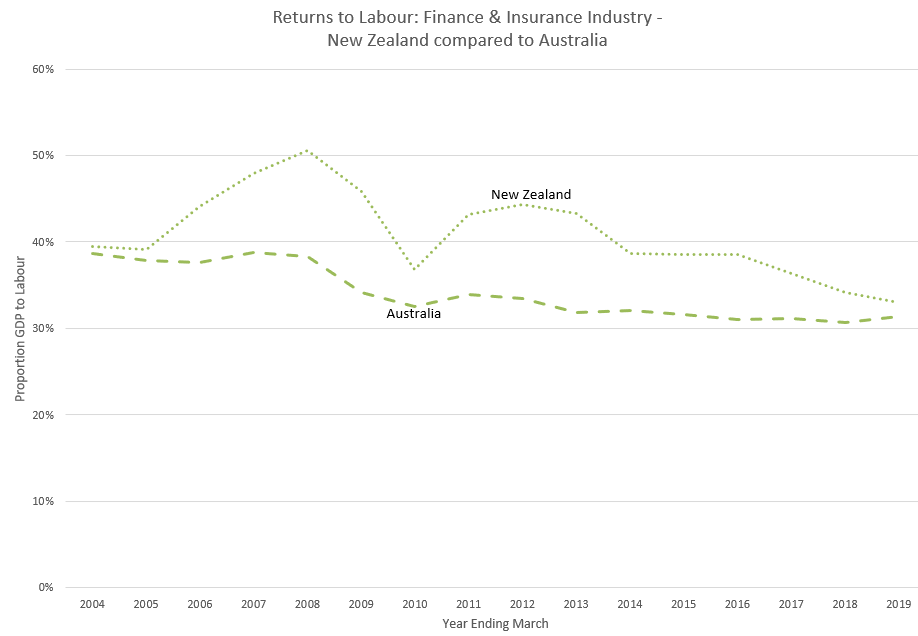
Unfortunately, we cannot see into the returns to the Australian banking industry from these official statistics and compare against the New Zealand industry’s returns.
While we don’t know the individual contribution of Bank and the Insurance industries to the larger aggregated Australian total, from New Zealand’s statistics the Insurance industry contributes 33% – 40% of the value added to the combined aggregate New Zealand industry. And as seen from the first graph for New Zealand, with only 20% of the returns to production of the insurance industry going to labour, the industry is highly capital intensive.
Not much of a story can be derived from comparing the aggregated financial industry data 🙁
Again… poos.