
New Zealand is currently in the worst economic recession since the Mother of All Budgets back in 1990. Our Golden Years (1998 – 2008) are well behind us.
The business cycle
Here’s a little thing I fizzed up when I was at the New Zealand Institute of Economic Research but have rebuilt with a different set of metrics and updates for the seven years since I was there.
Stop and look at this graph a little bit…
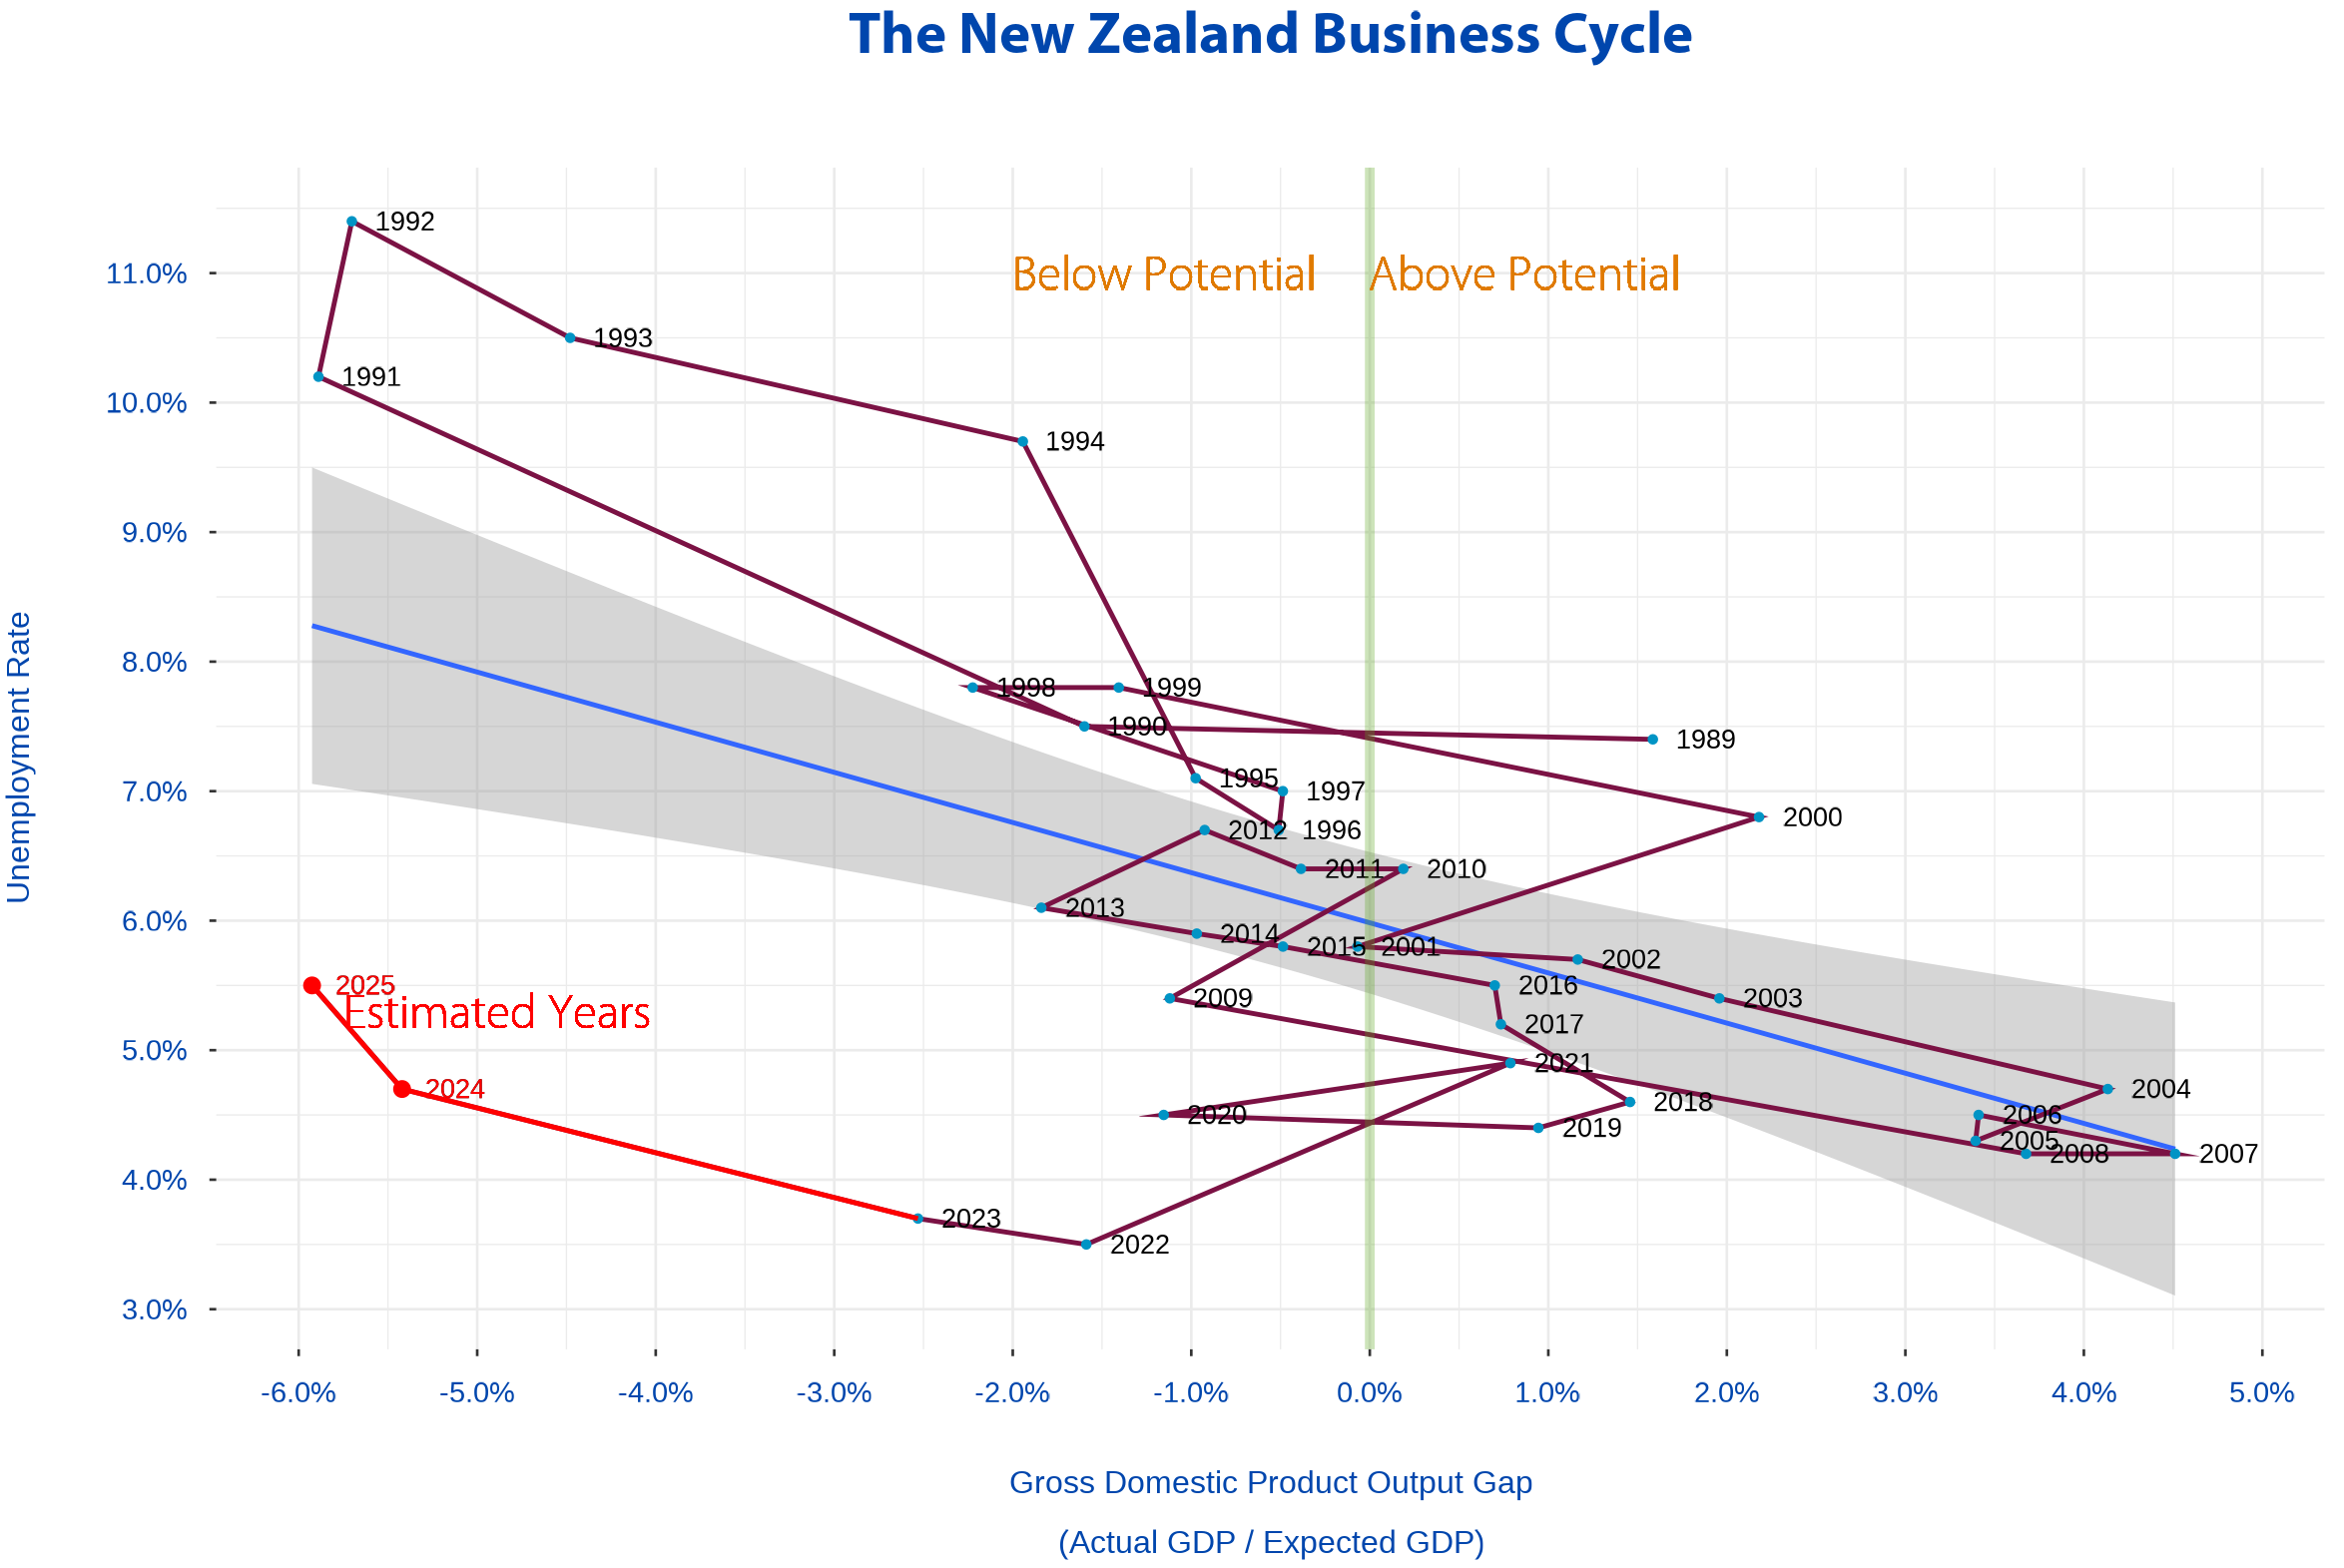
This is a picture which captures New Zealand’s Business Cycle – the regular periodic expansion and contraction economies go through ever since humans invented money.
Trace the lines through the dates, starting in 1989.
1980’s Yuppy Era
In 1989, New Zealand was still relatively fizzing from the David Lange / Roger Douglas reforms which liberalised New Zealand’s financial and imports market. Import licensing had been removed, the exchange rate floated and the New Zealand economy went off like a rocket.
My numbers pick up at the end of the boom.
The Mother of All Budgets
As ’80’s became the ’90’s, and things had started to cool. The exuberance of deregulation had fuelled a property and share market boom which crashed in 1987. And government-run organisations like the Bank of New Zealand were starting to wear the effects of politically-driven lending decisions which turned bad and poisoned it’s balance sheet.
The New Zealand economy cooled dramatically, but it was in the worst of positions. Having partially deregulated, it hadn’t fully deregulated. The old legal frameworks which still governed New Zealand’s labour market, saw the unemployment rate blow out to what are now unheard-of levels of unemployment when the breaks slammed on the economy.
Employment Contracts Act
Bolger’s government cut benefits and deregulated the labour market (read my NZIER article above). In 1992 two things happened: people got employed and the economy kicked into gear for the next four years.
New Zealand’s Golden Decade: 1998 – 2007
Between 1998 until the Global Financial Crisis really were New Zealand’s recent Golden Years.
Over this time, output massively expanded and unemployment had become permanently lower through liberalising the labour market.
We were richer, and employed. Unaffordable houses became a thing.
The lacklustre years: 2008 – 2013
Helen Clark’s government was in, and on came the “safety nets”. Working for families became a thing. Kiwisaver became a thing. China became our free trade partner and supplied most of our economic growth.
This is probably the period economic historians might say New Zealand started losing it’s mojo and ambition
Feeling Rich: 2014 – 2018.
2013 – 2018 was five years of good times with both good robust economic growth and expanding labour markets. But even before COVID, by 2018 and 2019 there were signs that the economy was starting to contract, and the brief period of economic growth had again turned.
Covid, Inflation, and Negative “Stimulus”: 2019 – 2025
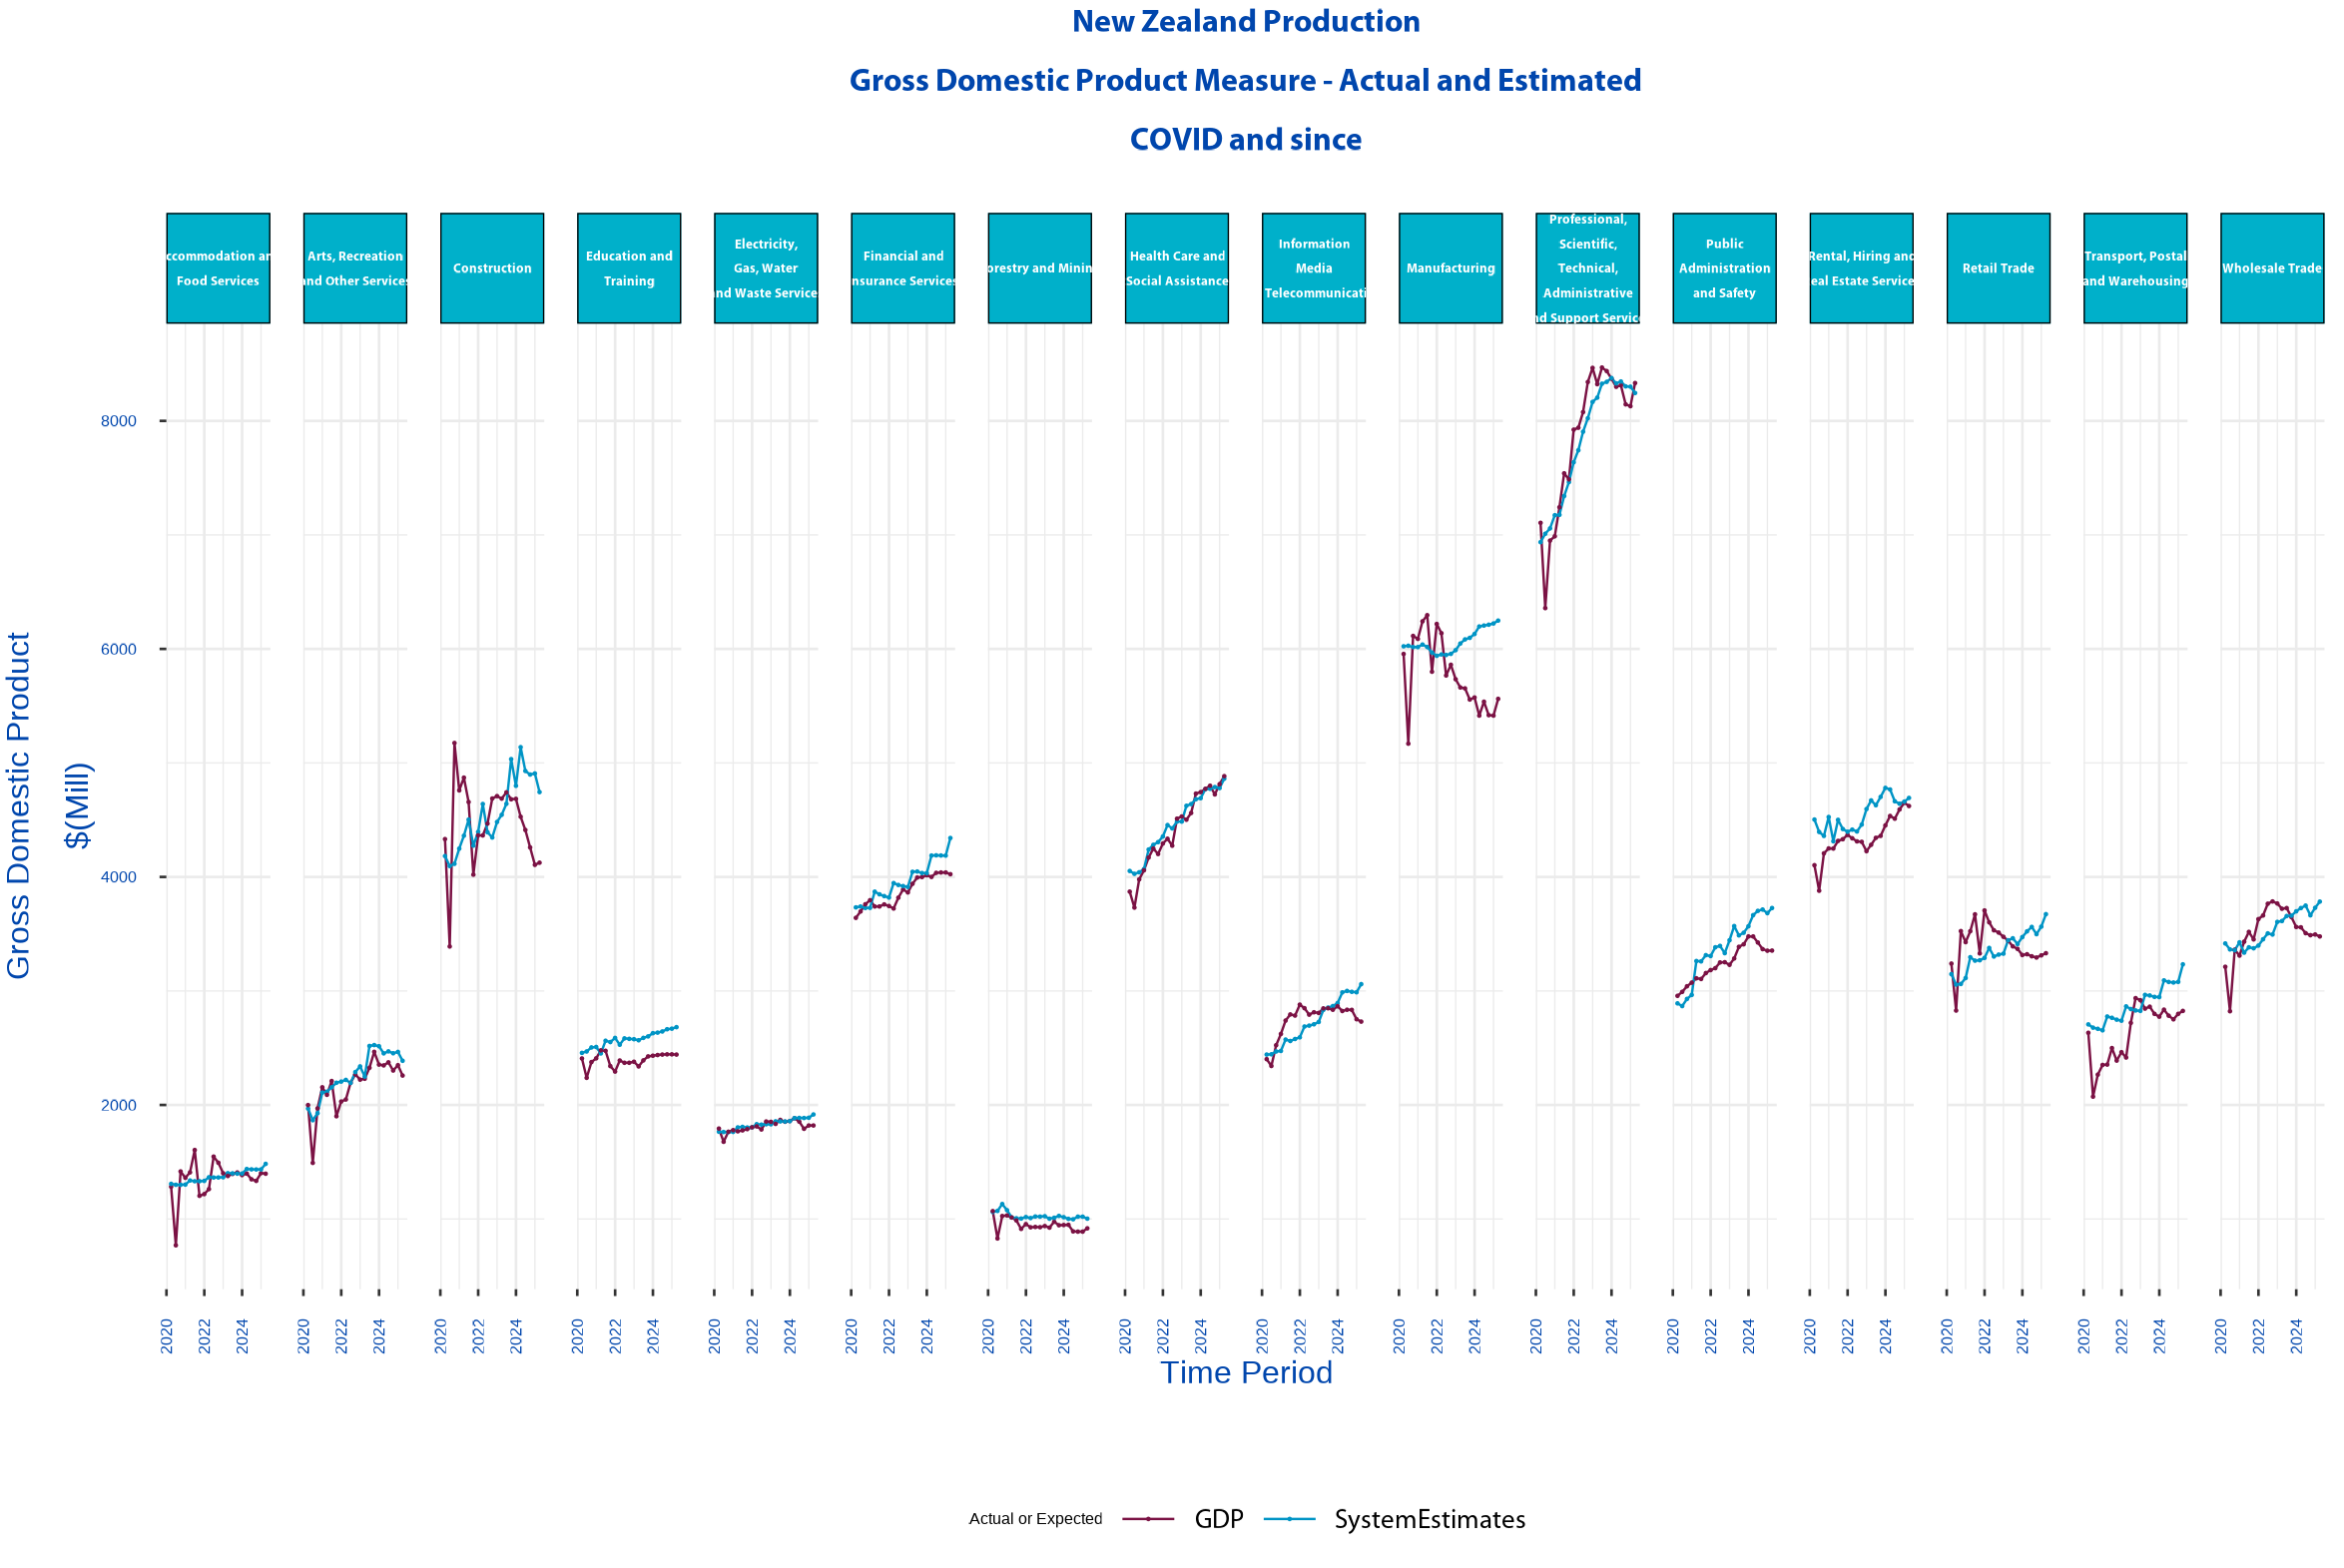
While it was massively disruptive to the fabric of society, and has undoubtedly created a cohort of students lacking the education fundamentals, 2019 – 2025 has been an absolutely awful economic period for New Zealand.
Looking at the post-covid period, there’s no surprises that the largest differences between GDP actual and expected output have been in Construction and Manufacturing. Retail trade, transport, wholesale trade, the media, and Government are all showing a lack of demand.
Covid itself, economically, wasn’t “too-bad”. The government artificially pumped up demand, resulting in 2021 being a year of surprising economic growth.
But it wasn’t to last. That artificial pump of fiscal and monetary demand was way too much for our little economy.
Loose money and loose credit found its was into New Zealand’s housing market. The household sector, fizzing on stimulatory fiscal policy (wage subsidies), all rushed to the bank for mortgages, driving a very rapid growth in both house prices and housing debt.
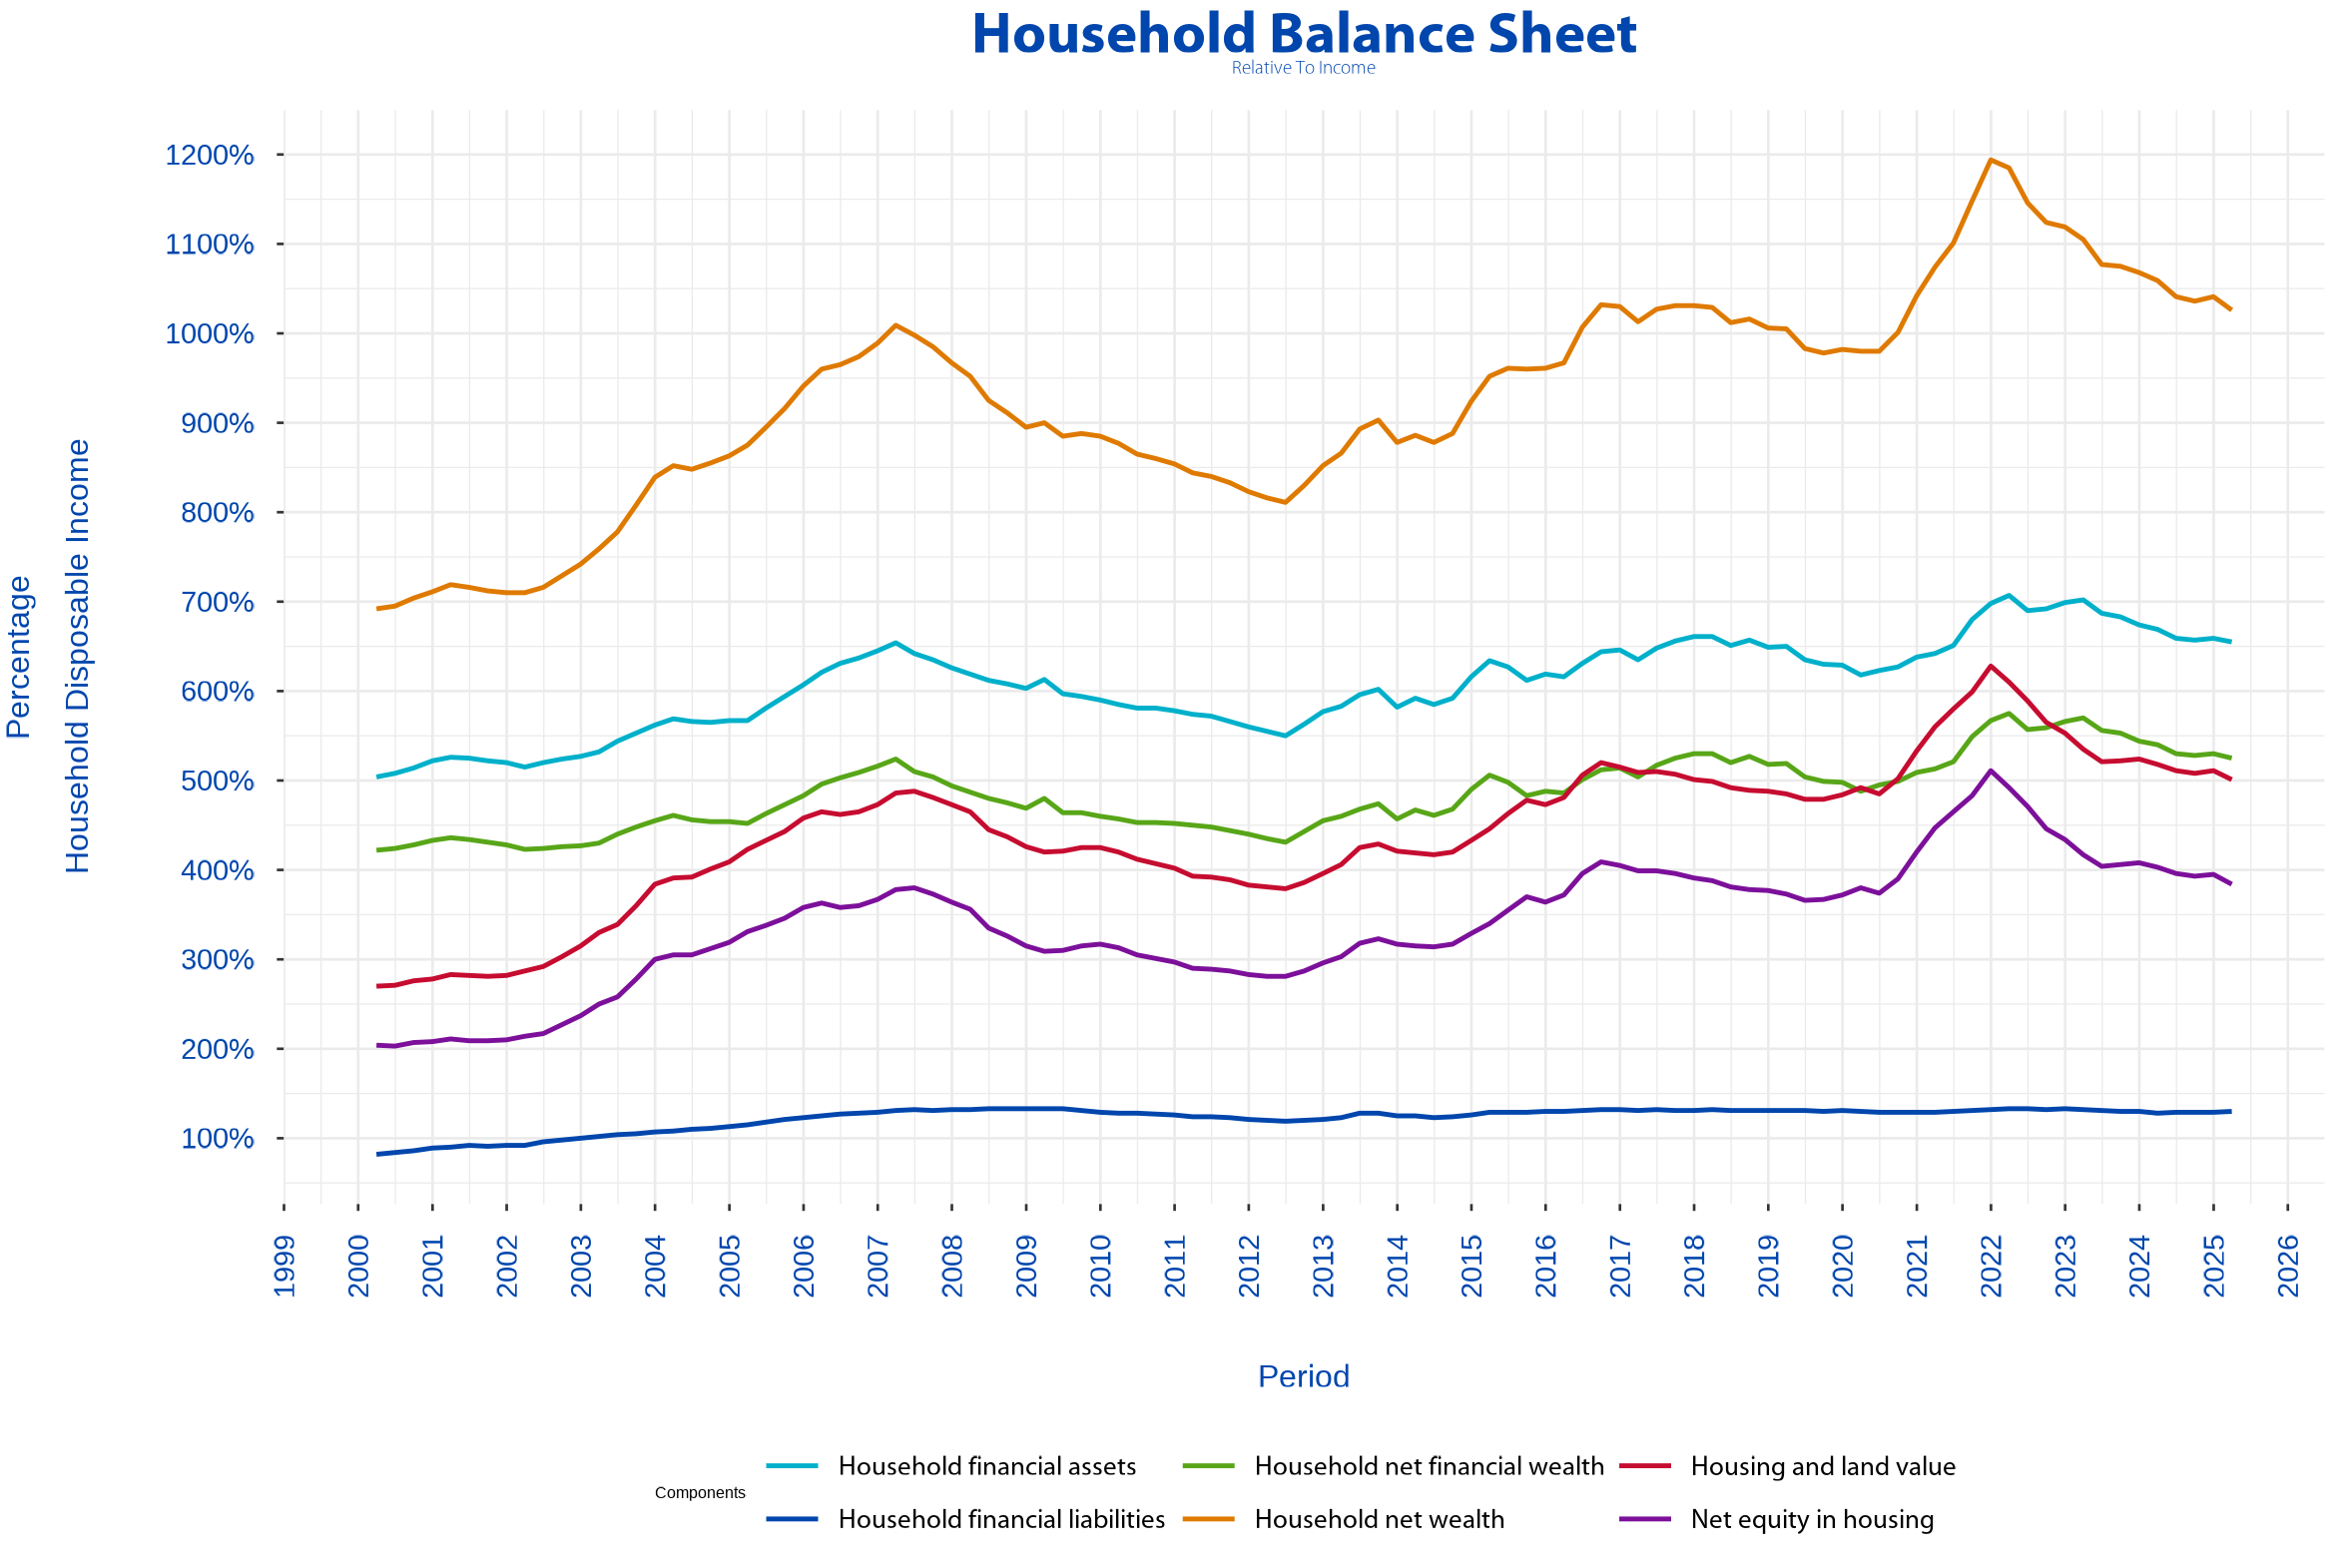
Households are worth 1200% more than their incomes
The above graph, derived from Statistics New Zealand’s Institutional Sector Accounts, gives a run-down for what happened to the household balance sheets. Easy money, from government borrowing and transfers to the household sector, and easy money saw housing prices grow to a level where they were 1200% more than household disposable income.
No, that is NOT a typo. If New Zealand’s household sector was just a single household which had, after tax, $1000 to spend then it would be living in a house that’s worth $630,000 (ish), and they’ve got another $575,000 (ish) in investments.
And $150,000 of that $630,000 “value” increase in housing came from the covid stimulus.
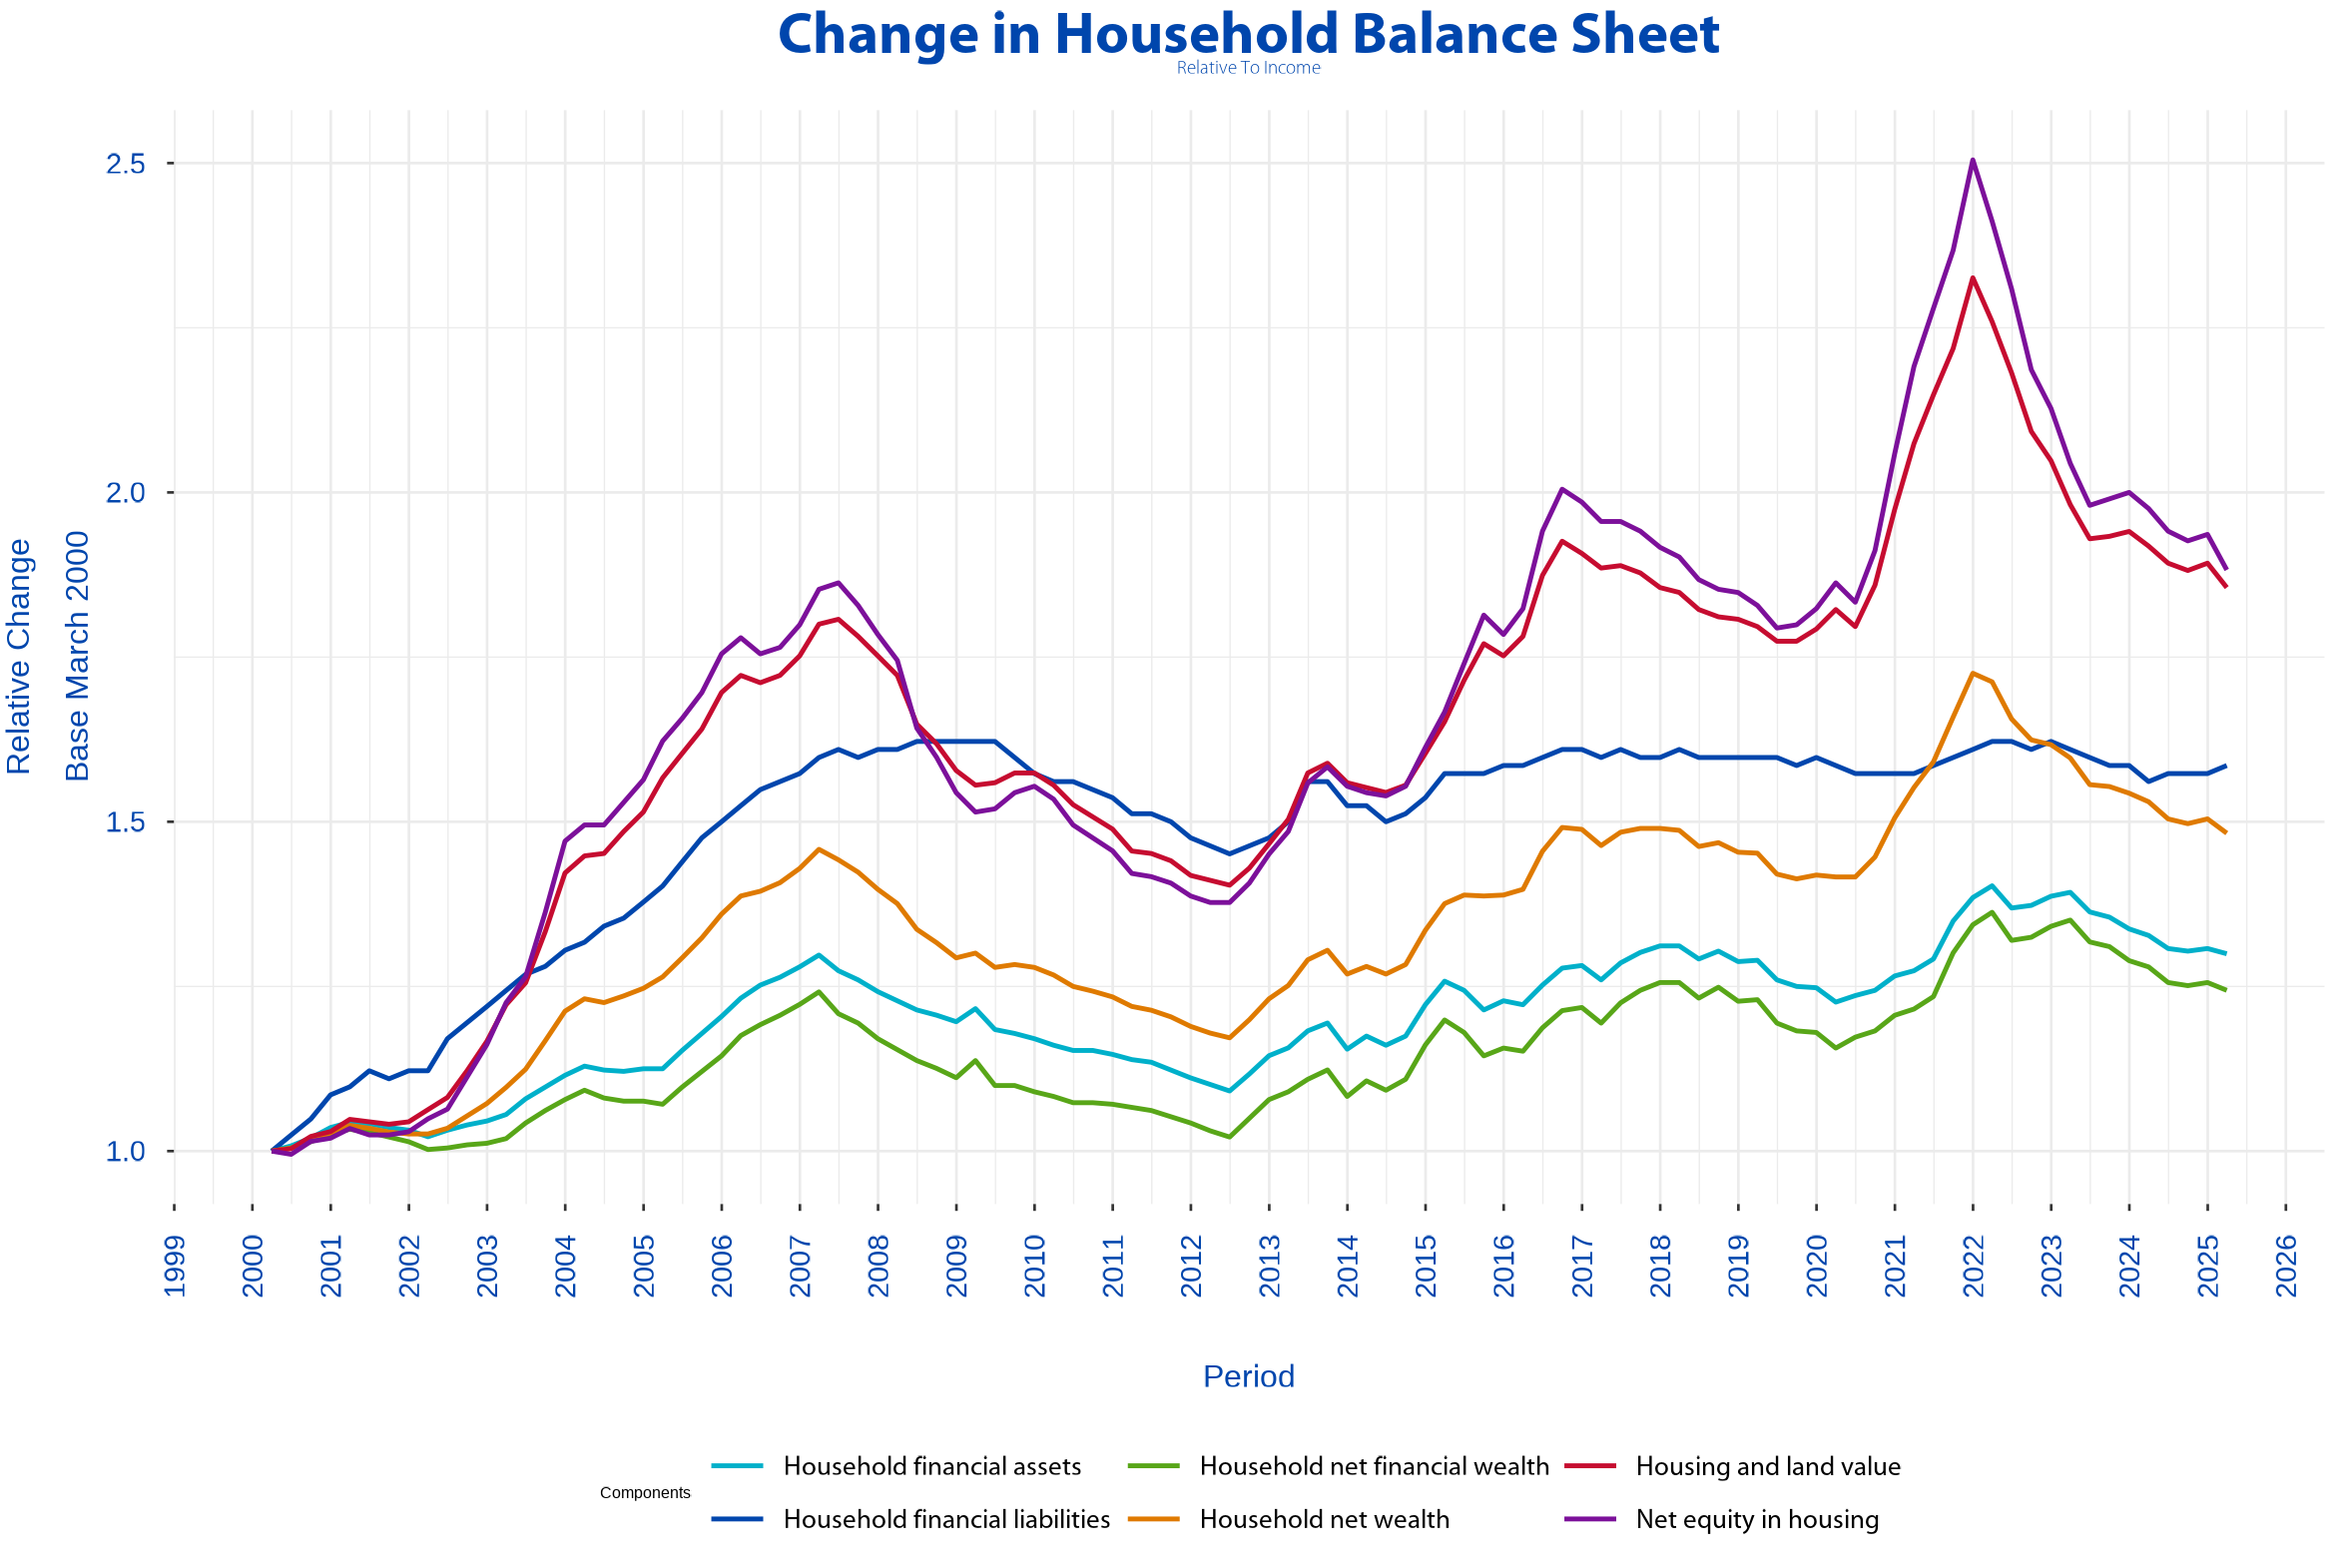
The picture below comes from the data above, but now you can see how comparably fast each component has grown. It shows nicely the effect of the lacklustre years (2007-2013), and unaffordable houses becoming a thing (1998-2008).
But you can also see the difference in “net equity in housing” verses “household net financial wealth”. Those squeezed out of the housing market were never going to make the same financial returns as housing through financial investments 🙁
Fighting inflation through killing the customer
Loosey-goosey money, and rampant house price inflation led to inflation everywhere, forcing the Reserve Bank to back track and “engineer a recession”.
Which is did, as seen in the first graph above.
But, as written here When was Inflation Beat? Inflation was beaten about 4 quarters longer than the Reserve Bank though it was.
And now, we’re are left living in the worst recession since 1992. And “For migrant departures in the January 2025 year, citizens of New Zealand were the largest group, with 69,200”
If you could move (ie. were young, educated and squeezed out of the housing market), why would you stay?
Pingback:Dead Hand of Government – Kiwisaver Edition – Over the Beer Mug