The Reserve Bank of New Zealand (RBNZ) this week dropped the Official Cash Rate (OCR) to 3.0% from 3.25%. In theory, that should flow through the banking system, and drop the “price of money” (the loan interest rate) which banks demand for mortgages.
Cheaper interest rates “should” increase demand for mortgages, translating into increasing housing demand leading to increasing housing sales. Depending on how much housing stock is sitting already for sale in the housng market, increasing housing sales may not automatically manifest in changes in sold house prices.
If there’s “excess supply” of houses (measured in long time listed on the market), then prices might not change until people actually twigg that the market has turned.
And then the prices change upward instantly 🙂
Indicator timeliness, representativeness and bias
This is really the name of the game: how do you know whether the market has change? Where might you look for signs of change?
Metrics like real-estates depend on their data sources. When derived from Real Estate agents, as soon as the transaction is completed, an indictor of changes in demand might be quick. But is the Real Estate company representative of the housing market? Does it have national coverage, or is it picking up regional demand signals.
If the metric is derived from the Real Estate institute, then it will be nationally representative, and would also reflect local demand, but the timeliness of the compiled indicator might not be quick.
Bank commentators are another source of information. There are no end to their commentaries across multiple media platforms. They draw from their organisation’s data so is both timely and representative. But… I always get the feeling that their commentary is biased – its in the bank’s interest to annouce a market turning point. The quicker they can bring about an increase in house prices, then the more money banks make from mortgages. They always seem to suggest the market has “just-now” turned and buyers get in quick for Fear Of Missing Out (FOMO).
Cotality (previously CoreLogic), is another data source. They collect property transfer data from the Local Councils and compile their statistics. Again, representative of the entire housing market, unbiased since they’re objective is to sell you data, not mortgages. And their timeliness is as quick as the Local Councils can process a property transfer document, and send them a file – probably a monthly process.
RBNZ Measures of Household Debt
Lastly, there is RBNZ data. Its readily available here: https://www.rbnz.govt.nz/statistics/series but you’ve got to know what you’re looking at. But it timely, representative and unbiased. But, its ‘the other side’ of a property transaction.
When a transaction occurs, two things happen: physical property physically (or legally) moves from the seller to the buy, and secondly money moves from the buyer to the seller. The first transaction happens in the “real” market, and the second happens in the “money” market. You can imagine these two markets as layered one over the other, with changes in one layer impacting on the other.
Money market-based changes, like the OCR, feed into the Real market changes because each transaction has these two physical and money dimensions. So decreasing the OCR lowers the price of money, which should increase the demand for mortgages, which means more buyers start turning up at auctions with pre-approved finance, leading to more house sales in the Real market.
With the Reserve Bank data, you have the money market activity which is a mirror of the real market activity. Its timely, unbiased, representative and FREE.
Households are increasing their mortgage debt
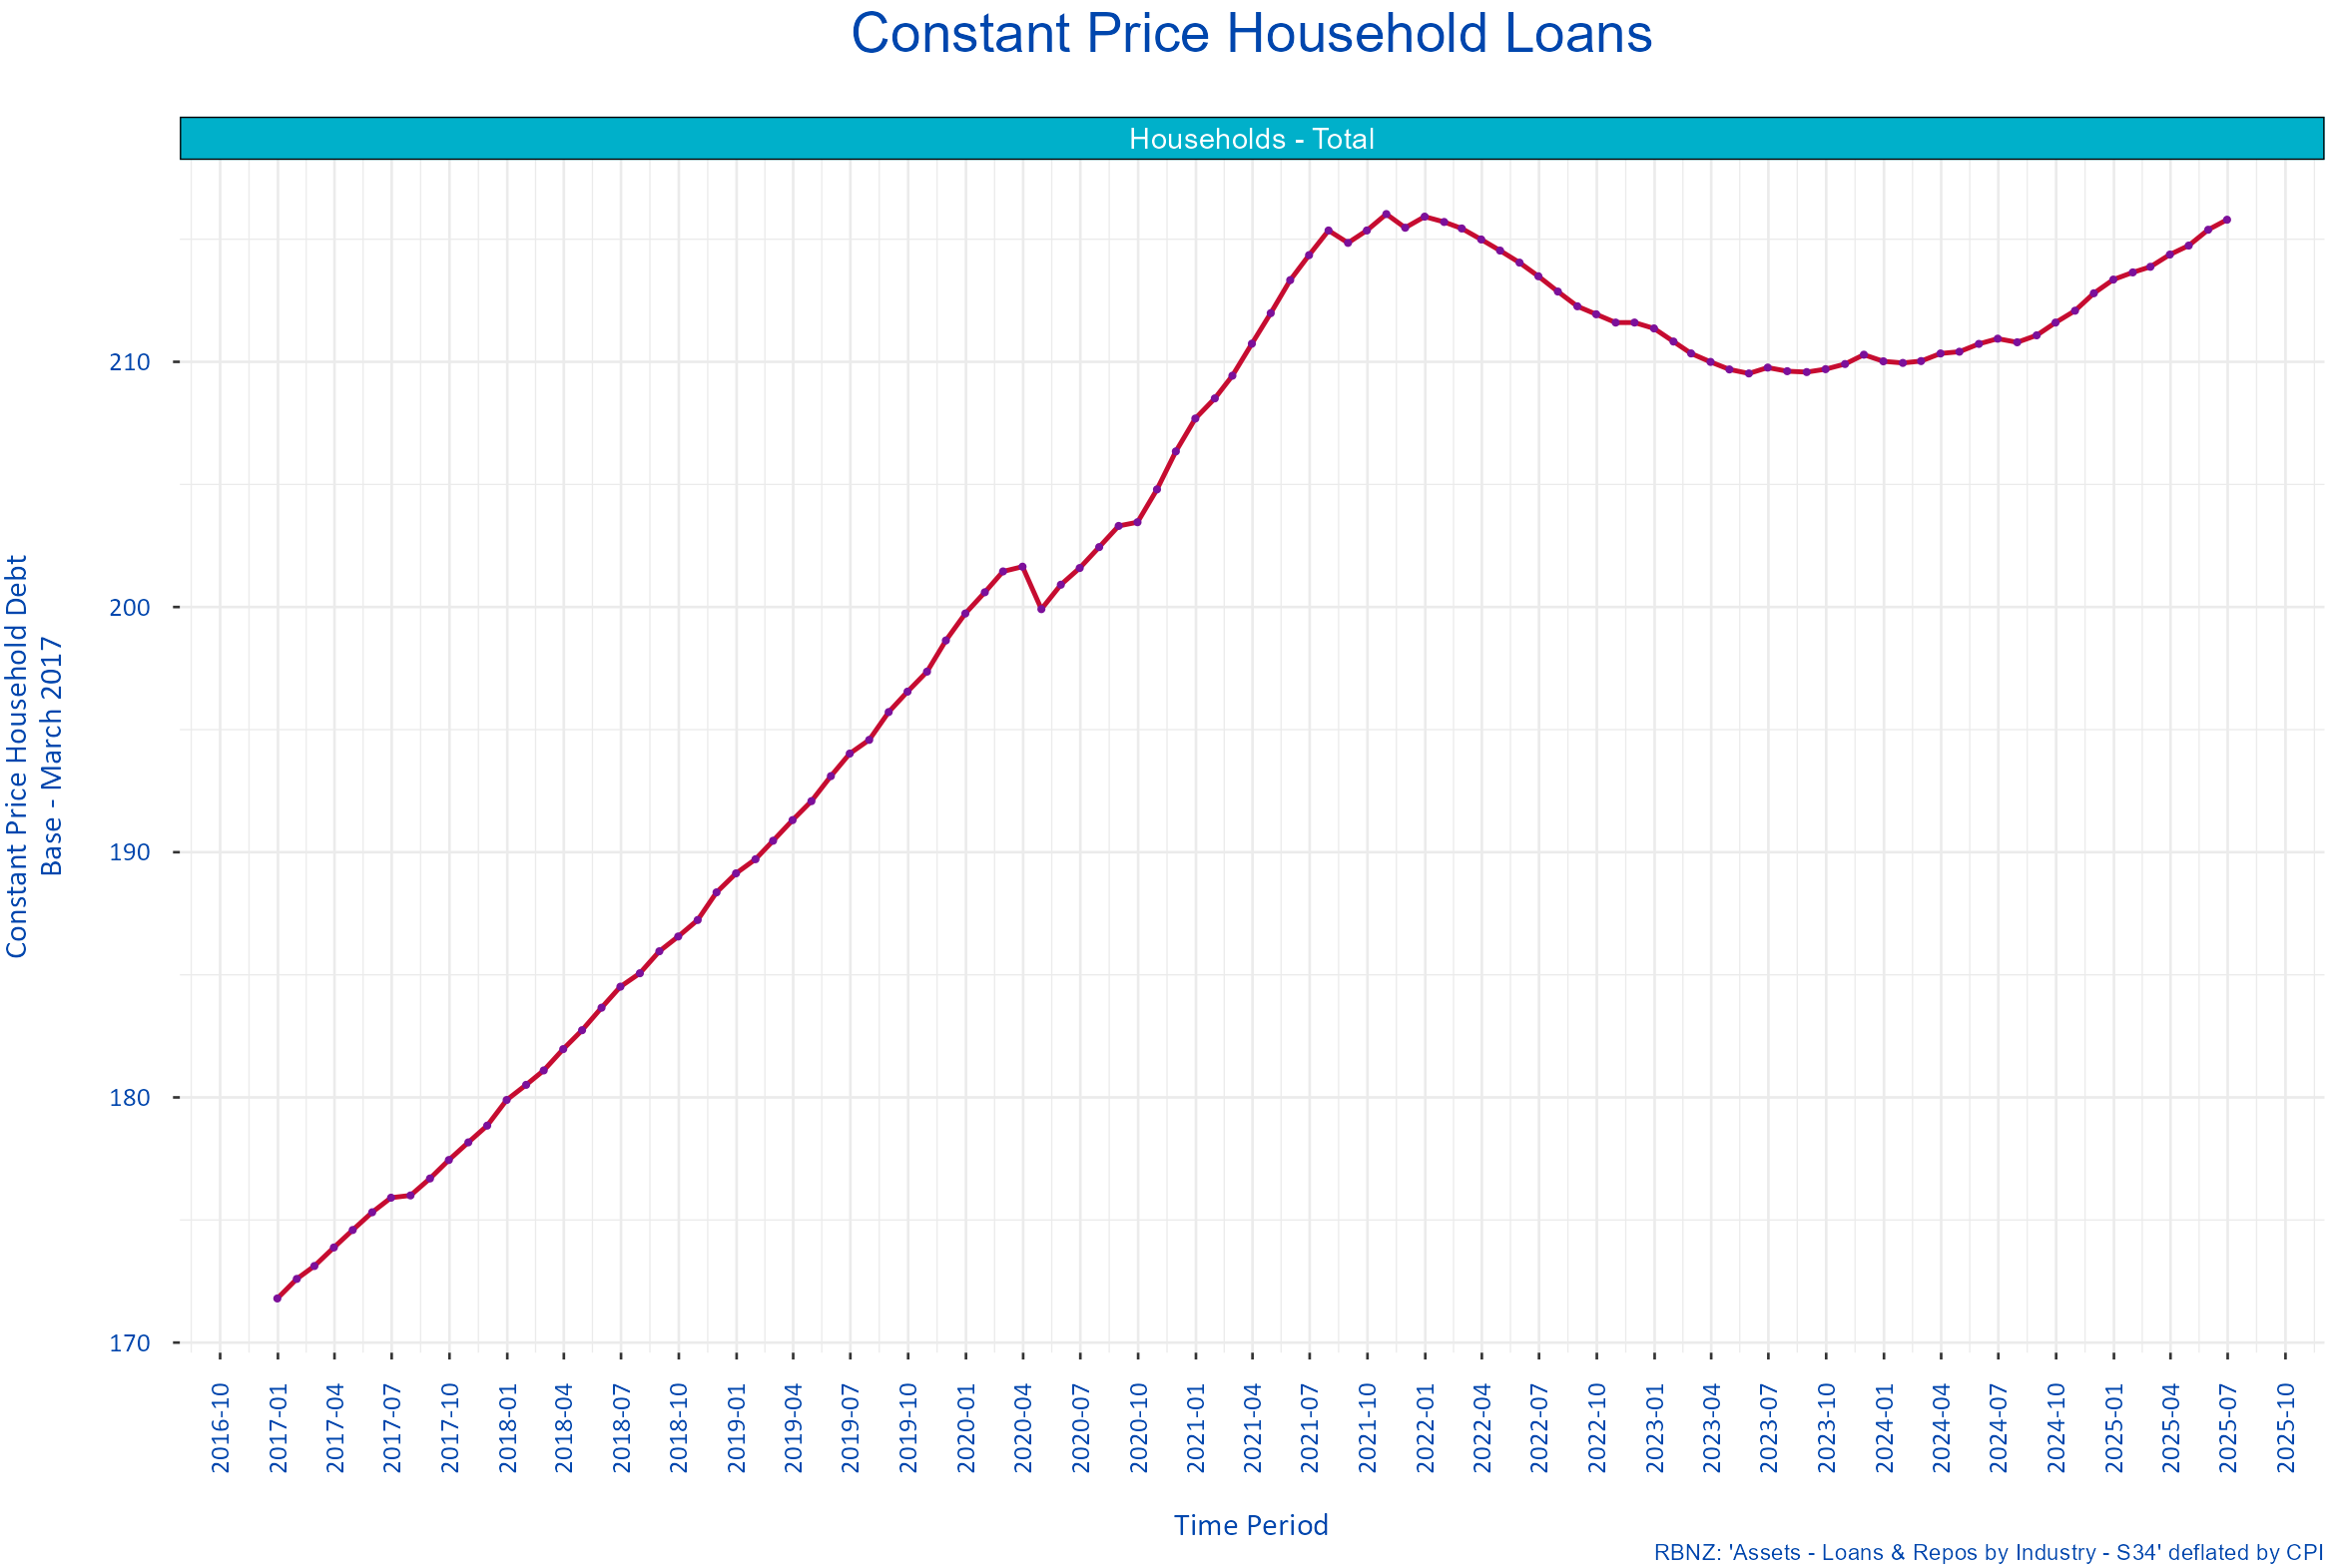
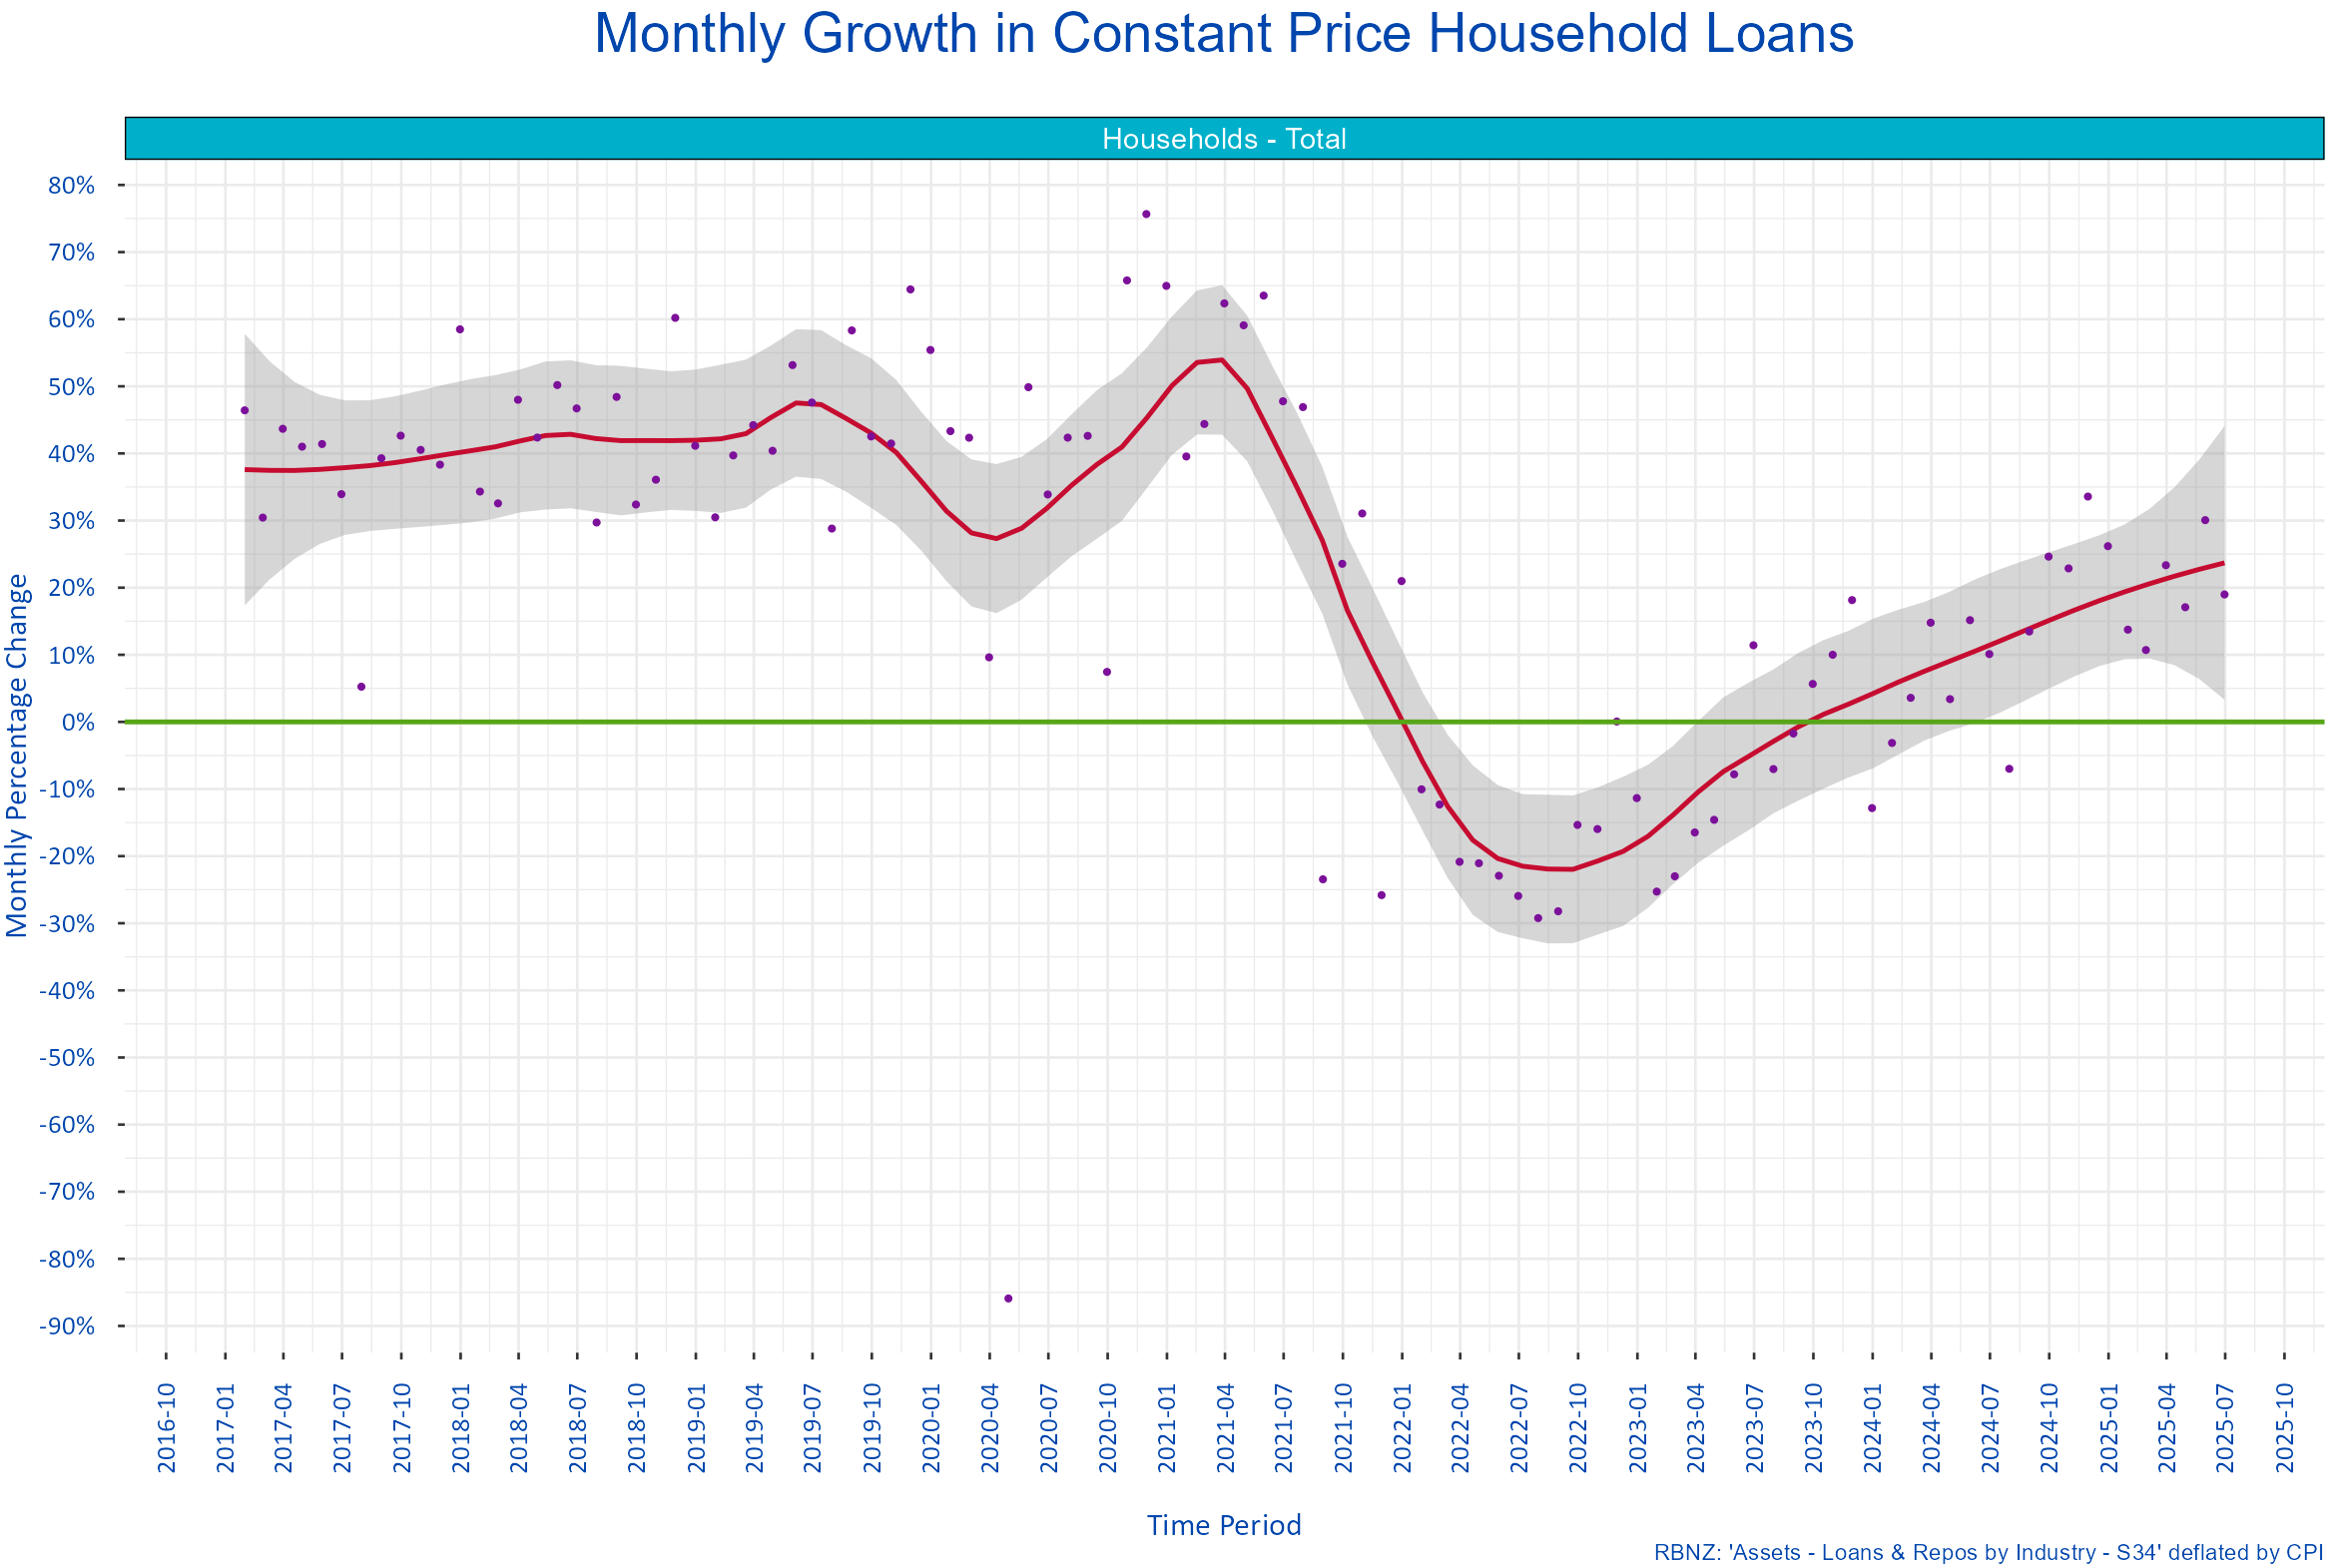
The two graphs below, with data sources from here https://www.rbnz.govt.nz/statistics/series/registered-banks/banks-assets-loans-and-repos-by-industry suggest that the household sector is starting to increase their housing appetite again: the demand for mortgages is increasing.
The data has been deflated by the CPI to remove the effects of general increases in prices over time. Deflation tries to create a measure of the change in the quantity component of a transaction so we can see whether the number of mortgages has changed. General price inflation is not the same as house price inflation, so some of the increase or decrease below will includes increasing(decreasing) house prices rather than an increasing(decreasing) number of mortgages. But good enough for government, right?
Housing market turning points
The peak of the housing market, based on the RBNZ data, happened in January 2022. Prior to then, that rate of mortgage growth had started falling from April 2021.
Between January 2022 – November 2023 housing demand, reflected in mortgage debt, was falling – households were paying off mortgages rather than taking them out.
Since November 2023, the quantity of housing debt has increased.
When did the housing market turn?
Its turned, but its not yet visible through “Real” market measures. Demand started to change in November 2023. Its now starting to gather pace.
Time to buy a house, at its current low price, but before people realise and prices instantly increase.